Stop Flying Blind with AI Agents: Meet OpenInspector (Zero-Instrumentation Observability)
"Debugging autonomous AI agents is a nightmare. Discover how to get full X-ray vision into your LLM workflows with zero code changes using OpenInspector."
Few years ago, we were building chatbots. Today, we are deploying autonomous AI agents. Whether through the SDKs of AI Providers, low-code platforms like n8n, or CLI tools like ClaudeCode and OpenClaw, AI is no longer just generating text. It is executing complex, multi-step workflows.
But there is a massive problem holding developers back: AI Agents are black boxes.
When an agent works, it feels like magic. When it fails, hallucinates, or gets stuck in an infinite loop burning expensive tokens, debugging it is an absolute nightmare. Traditional observability tools (like LangSmith or DataDog) are powerful, but they require you to install SDK wrappers or inject callback handlers directly into your code. If you are using pre-compiled agents or no-code platforms, injecting custom Python or JS is often completely impossible.
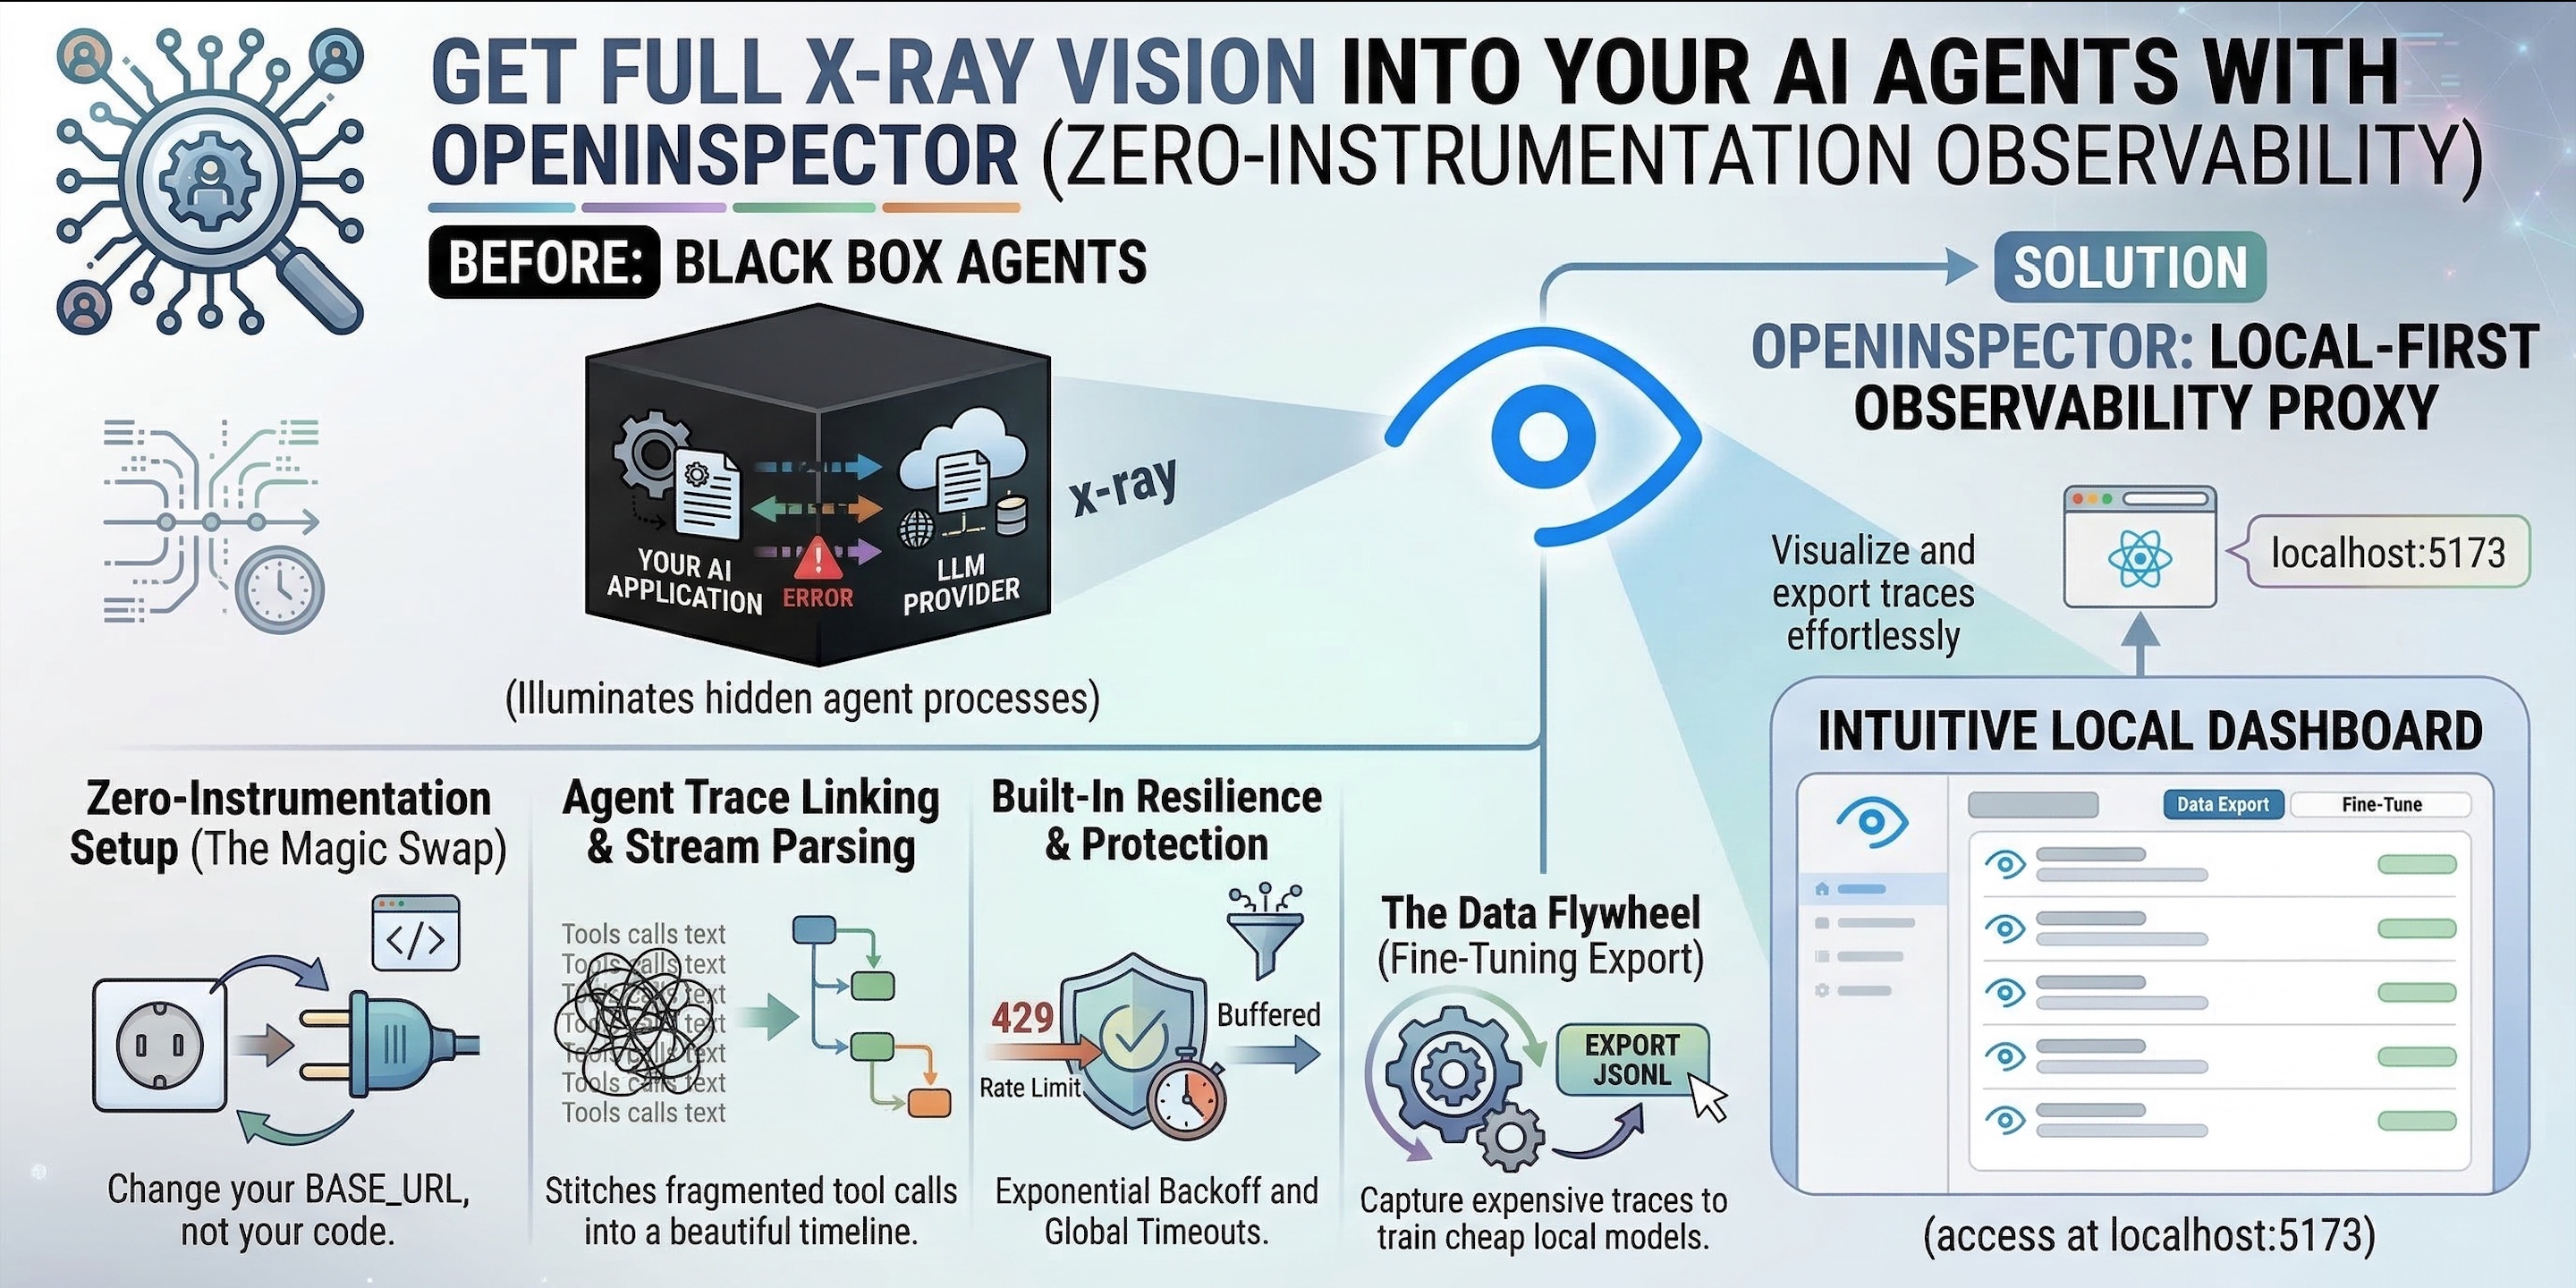
Enter OpenInspector: A lightweight, local-first observability proxy that traces LLM interactions without requiring you to change a single line of application code.
The Physics of Agent Debugging (Why Does This Matter?)
Tracing an AI agent is fundamentally different from tracing a standard web API. Agents “think” in hidden reasoning blocks. They invoke tools, read the results, and decide what to do next.
If you can’t see this internal monologue, you are flying blind. But why not just use standard tracing SDKs?
- Vendor Lock-in: SDK-based tracers tie your application architecture to a specific third-party dashboard.
- The “No-Code” Wall: You cannot easily inject Python logging callbacks into a drag-and-drop Flowise workflow or a pre-compiled CLI agent.
- Data Privacy: Sending your proprietary prompts and internal code logic to cloud-hosted dashboards is often a non-starter for enterprise environments.
The Golden Rule of AI Observability: If tracking your agent’s behavior requires rewriting your agent’s logic, your observability tool is broken. Change your network layer, not your codebase.
The Core Features
OpenInspector acts as a transparent middleman at the network level. Because it is API-compatible with OpenAI, Anthropic, and Ollama, it intercepts, logs, and manages the execution environment silently.
Here is what it brings to your stack:
1. Zero-Instrumentation Setup (The Magic Swap)
Stop rewriting your LLM calls.
Because OpenInspector works entirely at the network layer, setting it up is as simple as changing your BASE_URL environment variable. Point your tool to OpenInspector’s local port (8080), and you instantly get full tracing.
from openai import OpenAI

# Just change the base URL to point to OpenInspector
client = OpenAI(
    base_url="http://localhost:8080",
    api_key="your-actual-api-key" # Safely forwarded to the provider
)

# Note: You also need to point BASE_URL in .env to Actual Target URL
# Example:
# If using local Ollama - BASE_URL=http://host.docker.internal:11434/v1
# If using openrouter - BASE_URL=https://openrouter.ai/api/v1

# OpenInspector silently logs this, parses it, and forwards it
response = client.chat.completions.create(
    model="gpt-4",
    messages=[{"role": "user", "content": "Execute the master plan."}]
)
2. Agent Trace Linking & Stream Parsing
Make sense of the chaos.
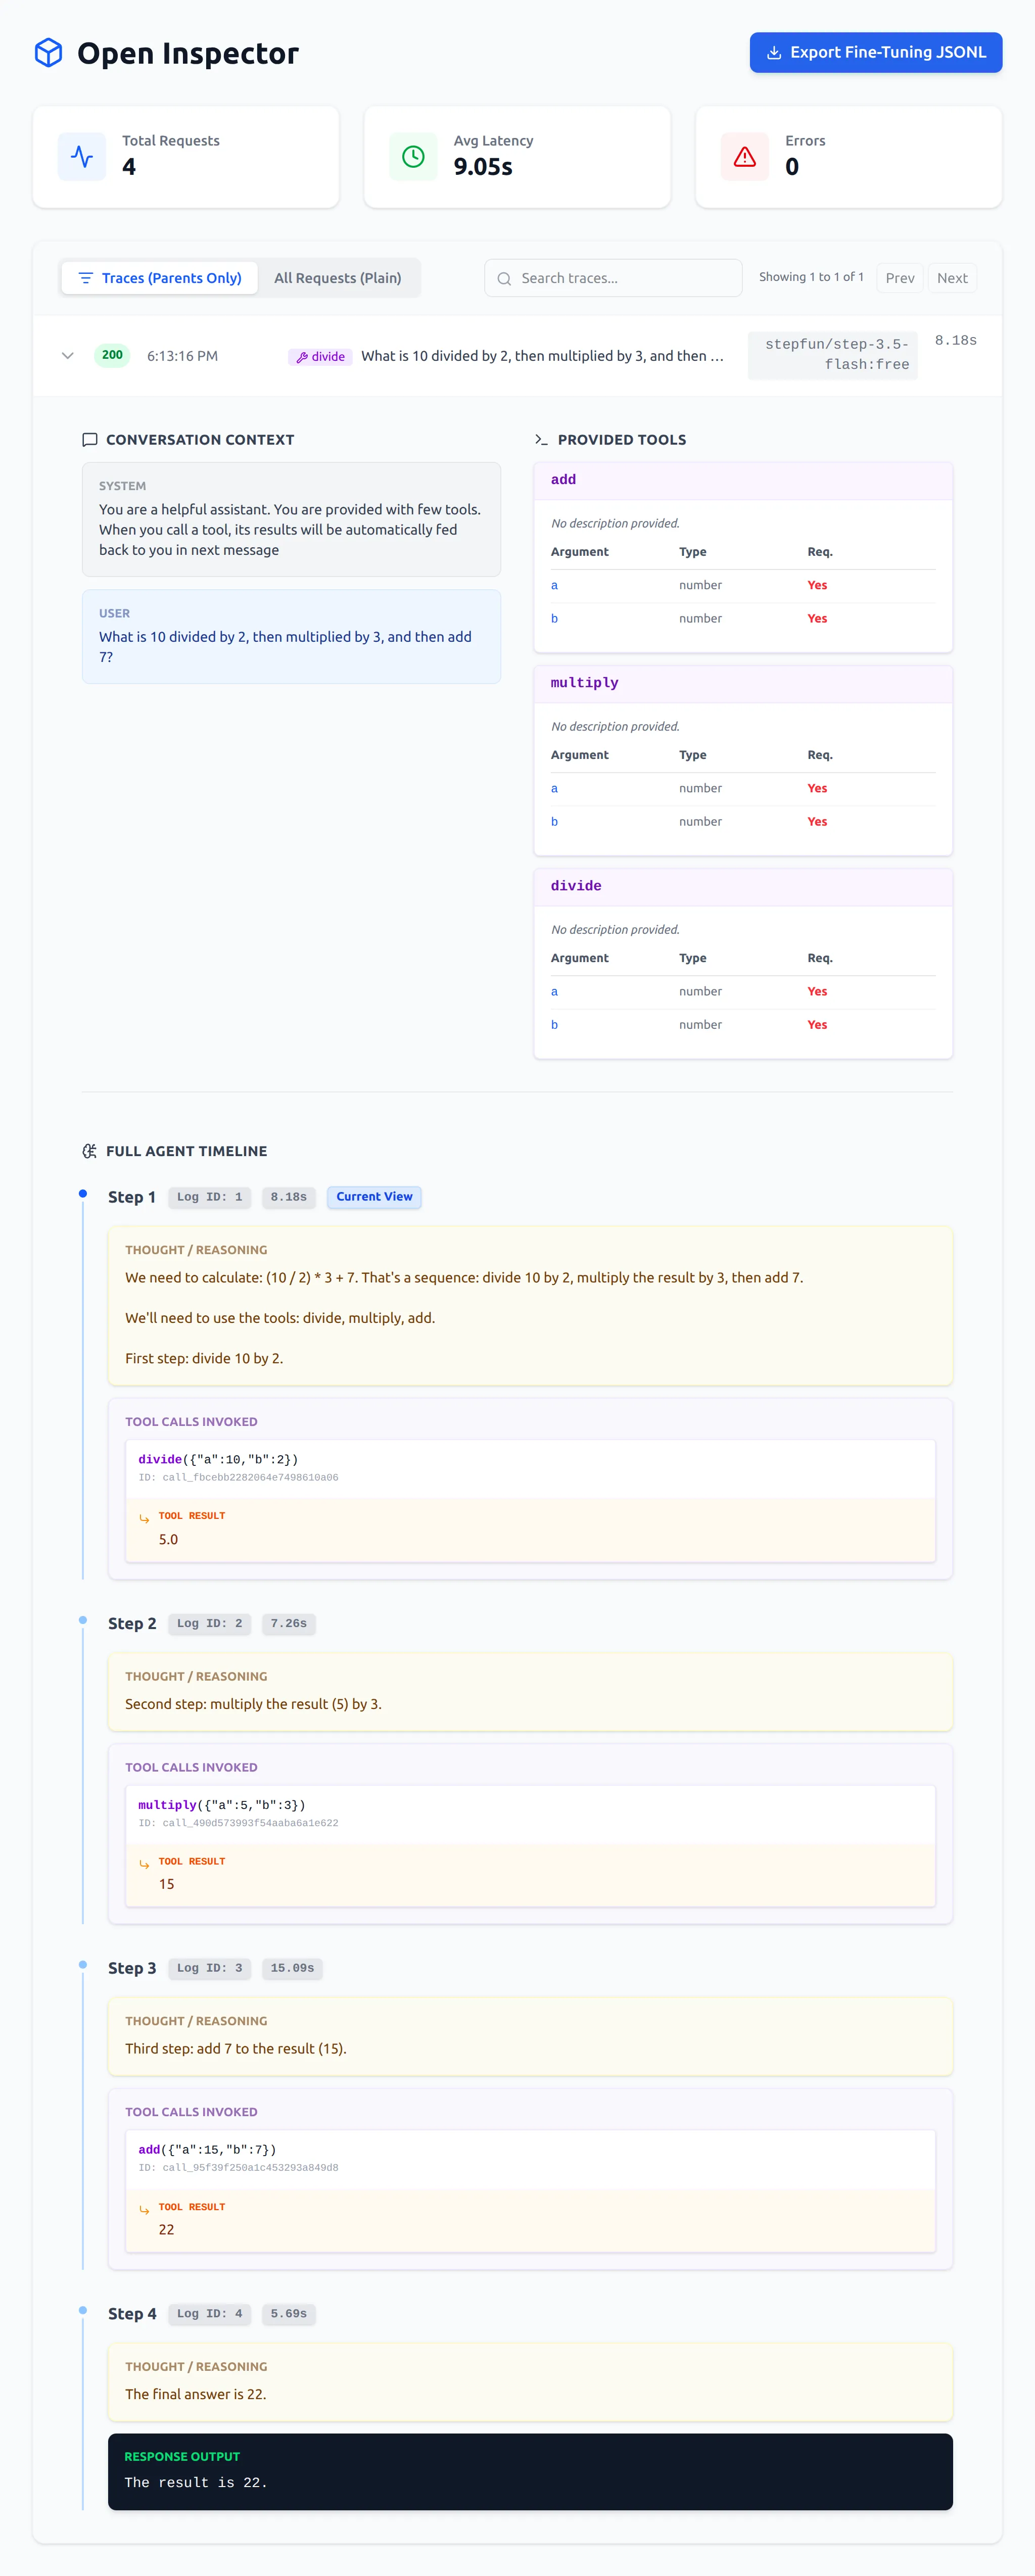
When an agent runs a multi-step workflow, the raw logs are a mess of streams and fragmented tool calls. OpenInspector intelligently parses these complex payloads. It extracts hidden reasoning blocks and stitches multi-step tool calls into a beautiful, visually readable timeline.
3. Built-in Resilience & Protection
Network errors and hallucinations shouldn’t crash your agent.
Hitting rate limits with OpenRouter? OpenInspector has built-in exponential backoff to handle 429 Too Many Requests automatically. Is your local Ollama model hallucinating? A strict global timeout monitor severs the connection before your agent gets stuck in an infinite generation loop.
4. The Data Flywheel (Fine-Tuning Export)
Turn expensive API calls into free local intelligence.
Want to train a smaller, cheaper local model on Ollama? OpenInspector features a 1-click export of your clean, successful conversation traces into OpenAI-compatible JSONL format ({"messages": [...]}). Easily capture the expensive reasoning from GPT-4 or Claude to fine-tune your own models.
Architecture: Under the Hood
OpenInspector is built with a modular, asynchronous architecture designed for high throughput and zero latency overhead.
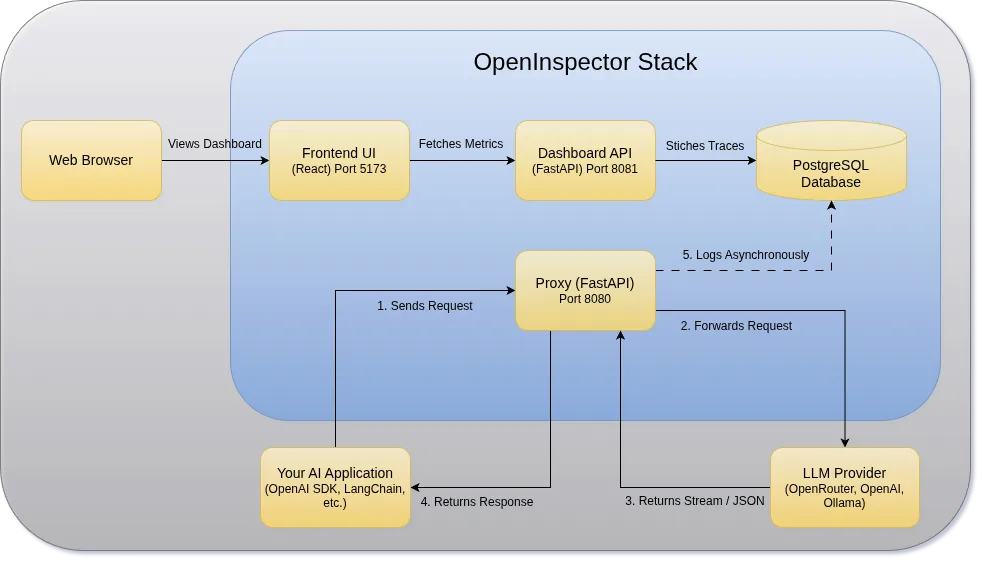
- FastAPI Proxy: Intercepts HTTP requests, normalizes streams, and handles retries.
- PostgreSQL: Durable, local storage for all logs and tool schemas.
- React Frontend: The visualization layer that stitches the timeline together.
- Dashboard API: Read-only API that executes complex SQL queries to stitch bidirectional agent traces and aggregate metrics.
Quick Start (Getting Started in 60 Seconds)
It provides a dedicated CLI tool to make spinning up the stack frictionless via Docker Compose. Everything runs locally, meaning your data never leaves your machine.
# 1. Clone the repo
git clone https://github.com/as32608/openinspector.git
cd openinspector
# 2. Setup your target provider
cp .env.example .env
# 3. Update the .env file with correct BASE_URL where you want to route
# (e.g., Ollama, OpenRouter, or direct Anthropic/OpenAI)
# 4. Start the services
chmod +x open-inspector.sh
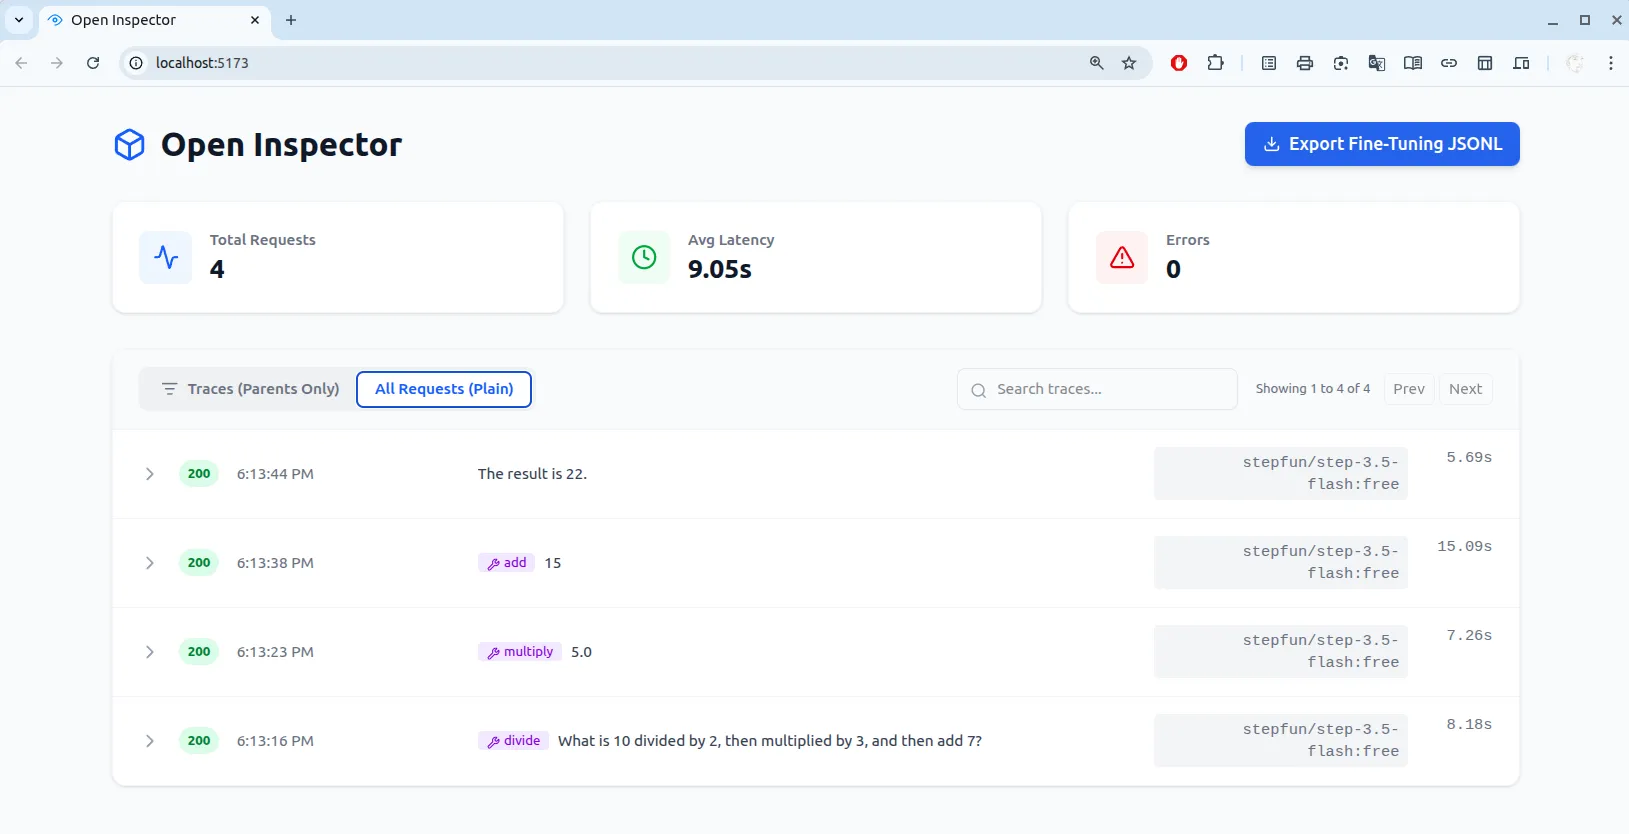
./open-inspector.sh startOnce running, open your browser to http://localhost:5173 to view the dashboard.
Best Practices & Pitfalls to Avoid
🟢 The “Do’s”
- Run Local First: Keep your
.envconfigured to run OpenInspector locally to ensure your proprietary prompts and internal architecture remain completely private. - Monitor Token Burn: Use the dashboard’s latency and request metrics to catch inefficient loops early.
🔴 The “Don’ts”
- Don’t Settle for Blind Trust: Never deploy an autonomous agent into production without a way to audit its internal reasoning steps. If it deletes a database table, you need to know exactly why it made that decision.
- Don’t Overcomplicate Setup: Resist the urge to write custom logging wrappers. Let the proxy handle the observability while you focus on prompt and context engineering.
Conclusion
We are rapidly moving away from simple prompt-and-response applications toward complex, autonomous systems. You wouldn’t run a traditional microservices architecture without network tracing, and you shouldn’t run AI agents without it either.
Stop guessing why your AI agents are failing. Take back ownership of your data and your execution traces.
Spin up your local observatory today: github.com/as32608/openinspector 🚀